Self-Hosted Uptime Monitor: Open-Source Node.js Alternative
Every team operating production infrastructure eventually faces the same question: how do we know when something is down before customers tell us? Hosted uptime monitors like Pingdom, UptimeRobot, and Better Stack solve this — but at a price, with vendor lock-in, and with all the trade-offs of letting a third party watch your stack. At CodeWiz, we ran into the limits of every existing self-hosted option and decided to build our own. Today we’re open-sourcing the result: Uptime, a self-hosted, MIT-licensed, single-process uptime monitor written in Node.js.
The project is available on GitHub at github.com/codewizdevs/uptime, with a full landing page (screenshots, feature tour, installation guide) at codewizdevs.github.io/uptime.
Why Another Uptime Monitor?
The self-hosted uptime monitoring space already has strong players. Uptime Kuma is the obvious reference — beautifully designed, huge feature set, big community. Healthchecks.io is the gold standard for passive cron-job monitoring. Gatus is config-as-code in Go. Statping-ng brings a polished status page. Each is excellent at what it focuses on, but each made trade-offs we weren’t willing to accept on production VPS deployments.
Specifically, we kept hitting four pain points:
Cloudflare interference. Most monitors interpret a Cloudflare JS challenge as a hard outage. They alert, they log a downtime incident, and they tank your uptime percentage — even though the site is perfectly healthy and only Cloudflare’s bot mitigation is filtering the probe.
No real team support. Either you have a single shared admin password (and everyone sees everything), or you have to buy a SaaS subscription. There was no clean middle ground for “let our junior dev see only these three monitors.”
Heavyweight deployment. Several mature options assume Docker, Kubernetes, or a multi-container compose stack. We wanted something that runs on a $5 VPS with one process and no babysitting.
No proper audit log. When you’re operating someone else’s infrastructure for them, “who pressed pause on this monitor at 3am?” is a question your customer will ask. Most self-hosted monitors can’t answer it.
Uptime was built specifically to close those gaps while staying small, fast, and operable.
Cloudflare-Aware Probing: The Feature Nobody Else Ships
This is the feature we’re proudest of, and to our knowledge it’s the one differentiator no other open-source uptime monitor has out of the box. The probe layer detects Cloudflare challenges via three signals — HTTP status, the cf-mitigated response header, and known body markers — and records them as inconclusive rather than DOWN. That means a midnight bot-protection wave won’t tank your uptime percentage, won’t open an incident, and won’t fire a false-positive alert at your on-call rotation.
On top of that, the prober rotates realistic browser user-agent strings (so it doesn’t look like a bot in the first place), automatically decompresses Brotli, gzip, and deflate responses (so body-string and JSON-path assertions actually see the decoded body), and offers an opt-in per-monitor “Cloudflare mode” that switches to HEAD-first probing, raises the minimum interval to 60 seconds, and applies adaptive exponential back-off after consecutive challenges. After five challenges in a row a single “being challenged” notice fires once — not five repeat alerts.
If you’re putting Cloudflare in front of your origin (and most teams are), this alone is worth the migration.
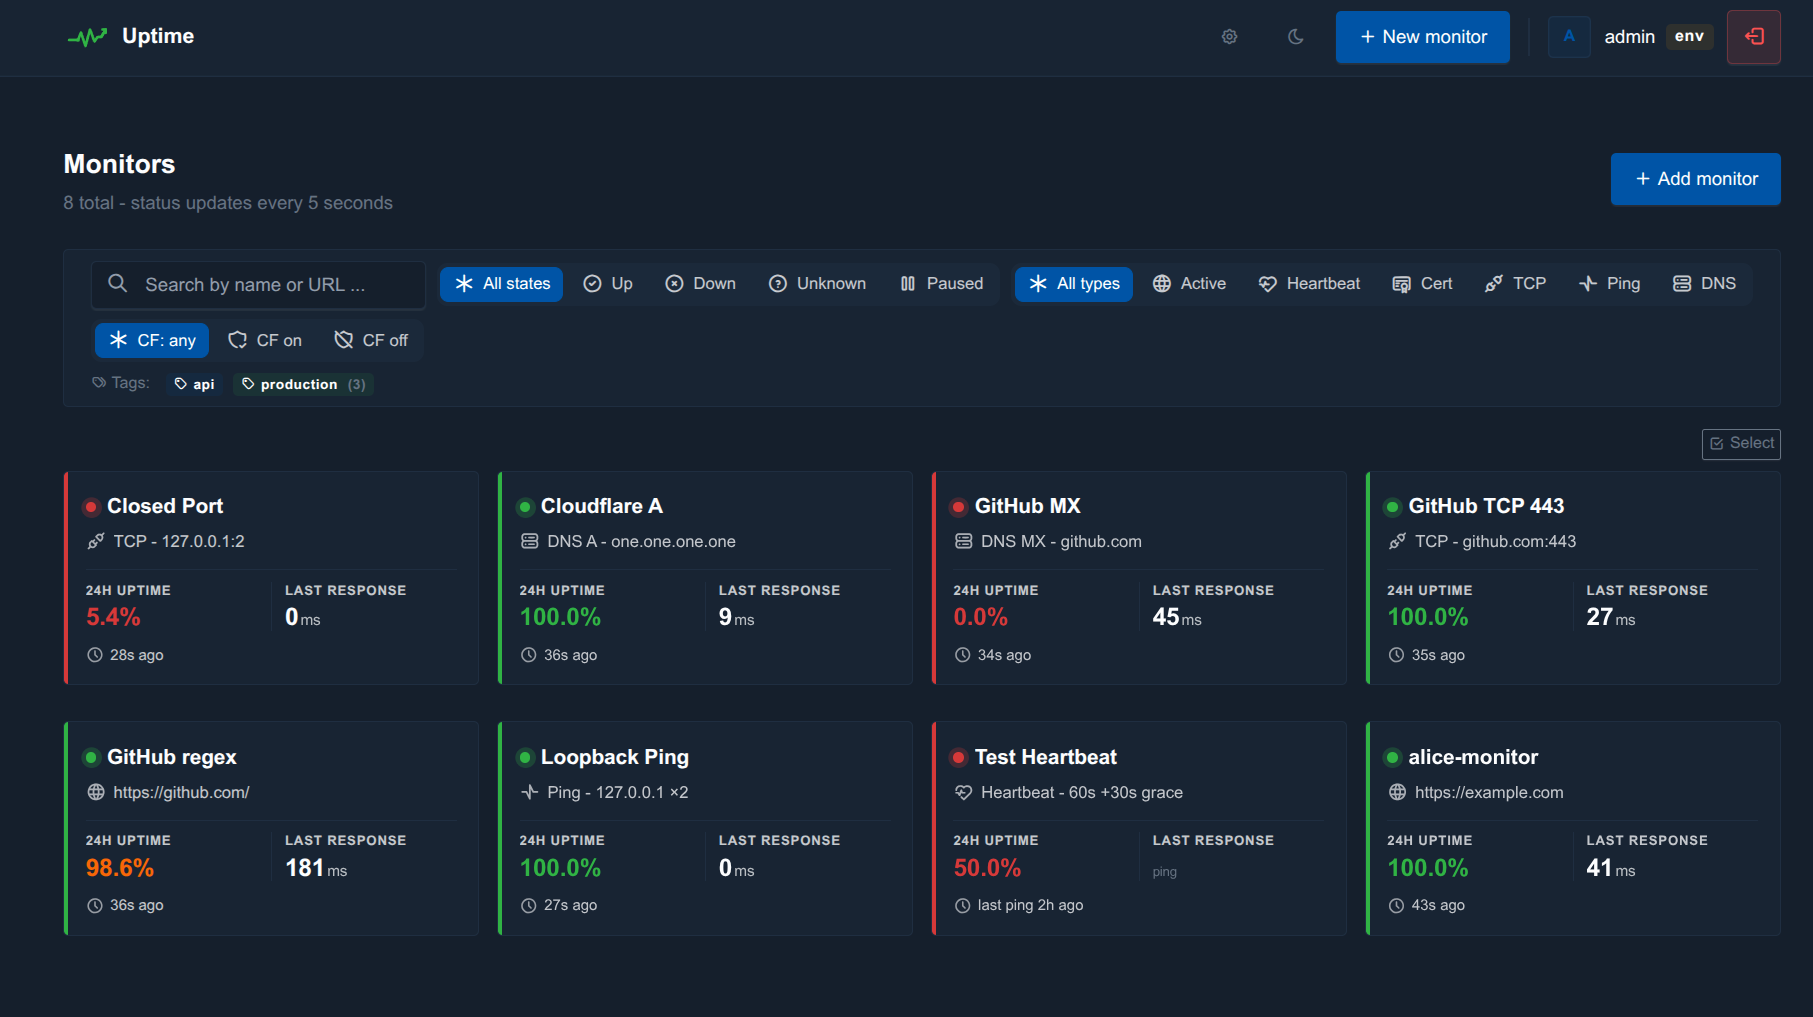
Six Monitor Types in One Tool
Uptime supports the full spectrum of probe types you’d expect from a mature monitoring tool, configurable from a single monitor form:
HTTP / HTTPS — with status-code, body-string, JSON-path, regex, and response-time-threshold assertions. Custom headers, Basic auth, Bearer tokens, follow-redirects, optional skip-TLS-verify, and per-monitor request bodies (POST/PUT/PATCH/DELETE).
TCP — raw socket connect to host:port with optional banner-substring assertion.
ICMP ping — shells out to the system ping binary, reports avg RTT, treats partial loss as failure.
DNS records — A, AAAA, CNAME, MX, TXT, NS, SRV, CAA, SOA, PTR. Optional custom resolver and substring or /regex/ expected-value match.
TLS certificate — a dedicated probe type that runs only the TLS handshake (no HTTP). Works for SMTPS, IMAPS, and other non-443 services. Tracks days-remaining and fires a cert_expiring alert at a per-monitor threshold (default 14 days).
Passive heartbeats — Healthchecks.io-style. Each monitor exposes /ping/<token>, /start, /0, and /<non-zero> endpoints. Bodies up to 4 KB are captured, exit codes and durations are computed across start/success pairs, and schedules can be interval-with-grace or full cron expressions in a chosen timezone.
Ten Notification Channels, Fully Customisable
Alerts fan out to any combination of Discord, Slack, Telegram, Ntfy.sh, Gotify, Pushover, Mattermost, Microsoft Teams, SMTP email, and generic webhooks. Each channel is independently configured, has a “Send test” button on its edit page, and can be attached to any number of monitors.
Every event type (DOWN, RECOVERED, CHALLENGED, CERT_EXPIRING, TEST) has its own title and body template with placeholders like {{site_name}}, {{site_url}}, {{error}}, {{status_code}}, {{duration_human}}, and {{cert_days_remaining}}. One click inserts a placeholder at the cursor; one click resets the template to default. A global APP_DEBUG=true switch turns every channel into dry-run mode — the would-be payload is logged to file instead of sent, perfect for tuning templates without spamming Discord.
Multi-User With Per-Monitor ACLs
The role model is deliberately flat and easy to reason about: admin, editor, viewer. On top of that, every monitor can grant individual users a per-monitor view or manage permission. The combination covers most real-world ops scenarios — “this client should only see their own monitors”, “this junior engineer can pause and resume but not delete”, “this read-only stakeholder gets a status link” — without devolving into the role-explosion that plagues enterprise RBAC systems.
The legacy .env-defined super-admin is preserved as a permanent break-glass account, with its own independent TOTP secret. DB users get their own. Passwords are hashed with argon2id, login is rate-limited and locked out after repeat failures, and every state-changing action lands in an audit log with the actor, IP, target, and structured JSON metadata. Non-admins automatically see only their own audit rows; admins see everything.
Public Status Page, REST API, and Prometheus Exporter
A read-only public /status page (with optional token gating) ships out of the box, complete with a 90-day daily uptime strip per monitor, ordered named groups, per-monitor display-name overrides, last-24h MTTR, and a companion /status.rss Atom feed.
The REST API at /api/v1/* uses bearer tokens with read / write scopes, and crucially — every response is automatically filtered through the token owner’s ACL. A viewer’s token sees only what the viewer sees. The Prometheus exporter at /metrics respects the same ACL, so you can hand a low-privilege token to your shared Grafana without exposing the entire monitoring estate. Series include uptime_monitor_up, uptime_monitor_response_time_ms, uptime_monitor_last_check_age_seconds, uptime_monitor_uptime_pct_24h, uptime_cert_days_remaining, and uptime_open_incidents.
How Uptime Compares
We did the honest version of this comparison. Every row below is verifiable against the public documentation of the tool in question as of May 2026:
Uptime (this)
Uptime Kuma
Healthchecks.io
Gatus
Statping-ng
Better Stack
License
MIT
MIT
BSD-3
Apache-2
Apache-2
Proprietary
Self-hosted
Yes
Yes
Yes
Yes
Yes
No (SaaS)
Runs without Docker
✓ Yes (1 process)
Yes
Yes (venv)
Yes
Yes
—
HTTP / TCP / Ping / DNS / Cert
✓ All five
Most
Passive only
Most
HTTP + TCP
All five
Heartbeats with cron + body capture
✓ Yes
Basic
Best in class
No
No
Yes
Cloudflare-aware probing
✓ Yes
No
No
No
No
—
Notification channels
10
90+
30+
Via shoutrrr
13
20+
Public status page + RSS
✓ Yes
Yes
No
Yes
Yes
Yes
Multi-user with per-monitor ACLs
✓ Yes
Coming
Teams only
No
Limited
Yes
REST API + Prometheus exporter
✓ Both (ACL-filtered)
Limited
API only
Read-only
API only
API only
Audit log per actor
✓ Yes
No
No
No
No
Yes
Login rate-limit + lockout
✓ Yes
No
Yes
No
No
Yes
Footprint
~150 MB · 1 process
~100 MB
~200 MB
~30 MB
~80 MB
—
The honest summary: Uptime Kuma has more notification channels and a bigger community; if you need 90 obscure pager integrations, use it. Healthchecks.io is the right answer if your entire workload is cron-job monitoring. Better Stack is what you buy if you’d rather pay than self-host. Uptime fills the gap when you want a single-process, MIT-licensed, multi-user-from-day-one, Cloudflare-aware tool you can clone onto a small VPS and have running in under three minutes.
The Technology Stack
Uptime is deliberately boring under the hood. It runs on Node.js 20+ with Express 4 and EJS templates — no SPA framework, no build step, no bundler. The HTTP prober uses undici with a shared keep-alive agent for performance. Data sits in SQLite via better-sqlite3 by default, or MySQL via mysql2/promise if you flip a single environment variable. Sessions are express-session, mail is nodemailer, charts are Chart.js loaded from CDN, the theme is Tabler CSS with vanilla JavaScript (no Bootstrap bundle).
The whole thing is one process, one log file, one optional PM2 ecosystem config. There’s a Dockerfile and a docker-compose.yml in the repo for teams that prefer containers, but neither is required. We’ve deployed it on a $5 VPS behind nginx with Cloudflare in front and watched it monitor 150 endpoints at ~50 MB resident memory.
Three-Minute Quick Start
git clone https://github.com/codewizdevs/uptime.git
cd uptime
npm install
cp .env.example .env
# edit .env — at minimum set SESSION_SECRET, ADMIN_USER, ADMIN_PASS
npm start
Open http://localhost:3000 and sign in. The schema auto-applies on first boot — no manual migration step, no setup wizard. For production, swap npm start for pm2 start src/server.js --name uptime && pm2 save and put nginx (or Caddy, or Cloudflare Tunnel) in front. The README has a copy-pasteable nginx vhost example.
Open Source, MIT-Licensed, Contributions Welcome
Uptime ships with the same MIT license we use across our open-source work. Fork it, modify it, redistribute it, fold it into a closed-source product, embed it in a SaaS — the only condition is keeping the copyright notice. The full source tree, screenshots, comparison matrix, and architecture documentation live at:
Detailed roadmap: the PLAN.md in the repo tracks shipped and deferred phases
Built on CodeWiz Values
Uptime is the latest in CodeWiz’s ongoing series of open-source operations tooling, joining projects like the Cloudflare Tunnel Manager. As a full-stack development agency based in Banja Luka, Bosnia and Herzegovina, we build tools we’d want to use ourselves and release them when they’re stable enough to be useful to others. Practical, well-documented, lightweight, easy to deploy — that’s the bar.
Need Help With Deployment or a Custom Integration?
Most teams can deploy Uptime themselves in under an hour. If you’d rather have it done for you — set up on your VPS, integrated with your existing channels, configured behind nginx or Cloudflare Tunnel, with monitors imported from an existing tool, or extended with a custom notification channel or single-sign-on integration — we offer that as a paid service. Reach out at [email protected] or through the CodeWiz contact page and we’ll scope it with you.
If you build something on top of Uptime, or you’d like a feature we haven’t shipped yet, open an issue on GitHub — we read every one.
Ready to Get Started?
Let's discuss your project requirements and find the perfect solution for your business.