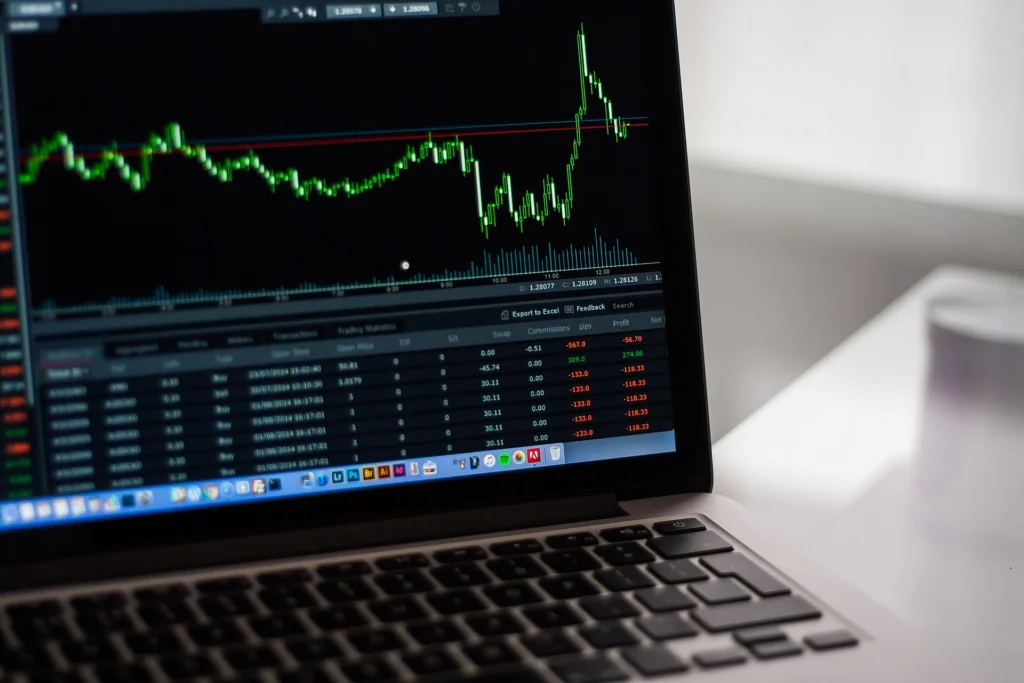
Monitoring and logging tell you that something is wrong while there is still time to fix it, and then show you which request, query or server was involved. Without that, a slow checkout or a full disk becomes a customer email, and the only diagnostic tool left is logging into a machine that may already be unresponsive. With it, a chart moves, an alert fires, and the log for that request is one search away.
Contents
At CodeWiz we set up Prometheus and Grafana for metrics, the ELK stack or Grafana Loki for logs, OpenTelemetry when a request crosses several services, and alerts that reach a person who can act. The same work covers Laravel, Node.js, WordPress, queues, databases and the servers under them. You get dashboards, a retention policy that will not fill the disk, and a short list of alerts that mean something.
This is for teams who hear about outages from customers, shops that cannot tell a payment-gateway timeout from a database problem, and companies whose logs are files on a single server. If the last incident started with “the site feels slow” and ended with someone tailing a log over SSH, the gap is monitoring, not another rewrite.
For logging, open-source tools are the default when they fit the job.
Prometheus and Grafana for Metrics
Prometheus collects numeric time series by scraping HTTP endpoints on a schedule. Grafana is the place those series become charts, and Alertmanager is the place a query becomes a message. Together they answer the questions you ask during an incident: is error rate up, is latency up, is the disk full, is the queue growing, did a deploy line up with the change?
A logging engagement starts from the system you already run.
What we put on a dashboard
- Rate, errors, duration for each HTTP service: requests per second, the share of 5xx responses, and latency at the 50th and 95th percentile.
- Saturation for the machine and the database: CPU, memory, disk, connection pools, Redis memory, queue depth.
- A deploy annotation, so a bad release is visible as a vertical line rather than a guess.
- Separate dashboards for the platform and for each application, built from the same metrics so they cannot contradict each other.
Applications expose a /metrics endpoint. Official client libraries exist for PHP, Node.js, Python and Go; for Nginx, PostgreSQL, MySQL, Redis and node exporters we use the existing exporters rather than inventing metrics. Prometheus’s overview of the Prometheus model is the reference for scraping, labels and PromQL. Grafana’s documentation covers dashboards and alerting if you later fold alerts into Grafana itself.
The logging work stays in your repository and on your infrastructure.
groups:
  - name: app
    rules:
      - alert: HighErrorRate
        expr: |
          sum(rate(http_requests_total{status=~"5.."}[5m]))
            / sum(rate(http_requests_total[5m])) > 0.05
        for: 10m
        labels:
          severity: page
        annotations:
          summary: Error rate above 5 percent for 10 minutes
The for clause is deliberate. A one-minute spike should not wake anyone. Ten minutes above a real threshold should. We keep label cardinality under control: route and status belong on a metric, a user id or a raw URL does not, because each unique label is a new series Prometheus has to store.
CodeWiz reviews logging in production, not only in a demo.

ELK Stack Setup for Centralized Logs
Metrics say that errors rose. Logs say which order, which exception and which deploy. An ELK stack setup means Elasticsearch for storage and search, a shipper such as Filebeat, Fluent Bit or Vector, and Kibana for the interface. Where a team wants to stay on a fully open-source distribution, OpenSearch and OpenSearch Dashboards take the same role. Logstash sits in the middle only when events need a heavy transform before they are stored.
Decisions about logging follow the business constraint that actually hurts.
How we keep logs useful and affordable
- Applications log JSON to stdout, with a timestamp, a level, a service name and a request id. The web server, the app and the worker share that id, so one search reconstructs the request.
- Secrets, session cookies, card numbers and passwords are not logged. We redact them in the application and again in the shipper.
- Retention is a decision, not a default. Access logs that nobody reads after a week do not stay for a year. Security-relevant authentication logs stay longer than debug logs.
- Index lifecycle policies roll indices and delete them. A logging disk that fills up is a common cause of the outage you were trying to diagnose.
For many sites the honest recommendation is Grafana Loki rather than Elasticsearch. Loki indexes labels, not every word, and it lives next to the Grafana you already have. We move to Elasticsearch or OpenSearch when you genuinely search the message body: a support team looking up an order id, an audit trail, a large volume of unstructured application logs. The stack follows the question, not a diagram we reuse for everyone.
Application Monitoring That Follows the Request
Application monitoring is the layer above host metrics. A server can be idle while a checkout is broken, because the time is spent in an external API, a lock or a single SQL query. We instrument the code paths that make money and the dependencies they call.
- Laravel and PHP: request duration, slow queries, queue wait time, failed jobs, and PHP-FPM pool saturation. WordPress gets the same treatment plus plugin-level errors and cron.
- Node.js: event-loop lag, HTTP duration, unhandled rejections, and the health of background workers.
- Data stores: connections, replication lag, cache hit ratio, and the queries that dominate database time.
- Traces: when a request crosses an API, a queue and a second service, OpenTelemetry records the spans. The collector exports them to Grafana Tempo or Jaeger, and the same request id ties the trace to the log line.
OpenTelemetry is the vendor-neutral way to do this. One SDK in the application, one collector on the network, and you can change the backend without rewriting the instrumentation. The project documents the model in What is OpenTelemetry?. We add it when there is more than one service in the path. A single WordPress site does not need distributed tracing to be well monitored.
Choosing a Monitoring and Logging Stack
The useful comparison is by the question each signal answers, not by which logo is currently popular.
| Signal | Question it answers | Where we start | When we change tools |
|---|---|---|---|
| Metrics | Is it slower, fuller or failing right now? | Prometheus and Grafana | A managed Prometheus if you do not want to operate the database |
| Logs | What did this request actually do? | Grafana Loki | Elasticsearch or OpenSearch when you must search the message text |
| Traces | Which hop in the chain was slow? | Tempo or Jaeger via OpenTelemetry | Skipped until more than one service is on the path |
| Uptime | Can a user reach the site from outside? | A small checker on another network | A second region when the check must not fail with the app |
Edge signals belong on the same wall. Cloudflare firewall events, cache hit ratio and origin errors explain a class of problems that never show up in application metrics. We have written about that configuration in Cloudflare configuration for performance. Frontend speed is a related dashboard, not a substitute: the work behind 100/100 page vitals is how the pages get fast, and these metrics are how you notice when they stop being fast.
Alert Systems That Reach the Right Person
An alert system that messages everyone about everything trains the team to ignore it. We alert on symptoms a user would notice: error rate, latency, failed checkouts, a down homepage. CPU, memory and disk are alerts only when they are about to cause one of those symptoms, or when they need a human before the next business day. Every alert links to a short note that says what it means and what to check first.
| Severity | Meaning | Where it goes |
|---|---|---|
| Page | Users are affected now | The person on call, immediately |
| Ticket | A human should look today | A queue, not a phone at night |
| Info | Useful on a dashboard | Nowhere. A chart is enough |
- Alertmanager groups related firings and silences a known maintenance window, so a deploy does not page five times.
- Routes go to email, chat or a phone according to severity. The channel is agreed with the people who will read it.
- We delete alerts that have not driven an action. A rule nobody trusts is worse than a missing rule, because it hides the next real one.
Uptime Checks from Outside Your Network
Prometheus on the same server as the application cannot tell you that the server, the network or DNS is gone. An external check, from another network, requests the homepage, a health URL and the certificate, and alerts when the answer is wrong or late. That check is small and should stay small. We have published how we approach it in a self-hosted uptime monitor: an open-source Node.js checker you can run yourself when a hosted status page is more than you need.
External uptime does not replace metrics and logs. It answers one question, “can a stranger open the site?”, and it keeps answering that question on the day the rest of the stack is the thing that failed. Certificate expiry and a failed TLS handshake belong in the same check, because both look like downtime to a visitor.
Common Monitoring and Logging Mistakes We Fix
- Dozens of alerts on day one, and a muted channel by the end of the month.
- Logs that exist only on the server that just became unreachable.
- A user id, an email or a full URL used as a Prometheus label, until the database falls over from cardinality.
- The monitoring disk sharing a volume with the application, so a noisy log takes the site down.
- Dashboards with no alerts, or alerts with no dashboard to open afterwards.
- Passwords, tokens and card data written into access logs “temporarily”.
- No retention policy, until Elasticsearch or Loki fills the disk.
What It Costs to Run
We estimate after looking at traffic, log volume and how many services you have. The number moves with a few predictable factors:
- Log volume and retention, which dominate disk and, on a hosted stack, the invoice.
- Metric cardinality: a careful label set stays cheap, a careless one does not.
- Self-hosted Prometheus, Loki and Grafana on a small VPS versus a managed vendor.
- Whether traces are in scope, and how heavily you sample them.
- How many applications, queues and databases need a dashboard and an alert.
- A handover with a runbook versus an ongoing arrangement where we keep exporters, rules and retention current.
How We Work
- Listen: we list the failures that actually hurt, the hours you can respond, and the logs and metrics you already have.
- Design: we choose metrics, logs, traces and the external check, plus retention and where alerts should go.
- Instrument: exporters, application metrics, structured logs and, where it pays, OpenTelemetry.
- Alert: a short set of symptom rules, each with a note on what to do, tested by firing them on purpose.
- Prove it: we walk through a rehearsed failure, from the alert to the log line, with your team watching.
- Hand over: dashboards, rules and a runbook. We can keep the stack patched and the rules honest afterwards.
Why CodeWiz
- We build the applications we monitor: Laravel, Node.js, WordPress and the queues around them, so the metrics match real failure modes.
- Open-source first: Prometheus, Grafana, Loki, OpenTelemetry and a self-hosted uptime check before a hosted suite you may not need.
- Sized to the site: a single shop does not get a tracing platform. A fleet of services does not get a single CPU graph.
- Fair pricing: premium development without premium prices, from Banja Luka, working remotely with clients locally and internationally.
- The rest of the stack in the same hands: performance, Cloudflare and the servers underneath. More on the about CodeWiz page.
Frequently Asked Questions
How much does monitoring and logging cost?
A small VPS running Prometheus, Grafana and Loki is enough for many sites and costs far less than the time spent debugging blind. Hosted Elasticsearch and long retention are what make the bill grow. We size it after looking at your traffic and log volume, and we say so if a smaller setup is the better one.
Do we need the ELK stack?
Only if you need to search the text of logs. For metrics, Prometheus and Grafana are the better start. For logs at moderate volume, Loki next to Grafana is usually enough. Elasticsearch or OpenSearch earns its place when support staff search order ids and exception text all day.
Will this slow the application down?
A metrics endpoint and JSON logs to stdout are cheap on a normal web request. The cost shows up in cardinality and in log volume, which we cap on purpose. Tracing is sampled so it does not record every request on a busy API.
How long does a setup take?
Host metrics, a handful of application metrics, centralized logs and a few alerts for one application are often in place within a couple of weeks. Several services, tracing and a careful alert review take longer, mostly because deciding what is worth a page is the real work.
Can you monitor a WordPress or WooCommerce site?
Yes. Uptime, PHP errors, PHP-FPM, MySQL, disk, certificate expiry and the checkout path. You do not need a custom metrics library in every plugin for that to be useful.
What should wake someone up?
The site being down, error rate or latency that users feel, and a failed payment or checkout path. A disk that will be full tomorrow can wait until morning. We write that distinction down with you before any rule goes live.
Ready to See Problems Before Your Customers Do?
Tell us what broke last time and how you found out. Contact us and we will propose a monitoring setup that fits the site, or see our monitoring and logging services.